Overall Equipment Effectiveness (OEE) is a well-established metric for monitoring highly automated machines, but it has a place in manual, operator-driven manufacturing environments also.
7 min read

OEE is an important performance measurement in most modern manufacturing facilities. It is a measure of how effectively a process is performing versus its maximum potential. It has gained a lot of traction in automated machine environments where software can be used to measure it. However, in manual assembly lines and cells, where paper or excel-based systems are traditionally used to track performance, this is not so easy. We’ll talk later in the article about how Kt-Pulse is helping companies to measure OEE in manual assembly environments, but first…
What is OEE?
OEE (Overall Equipment Effectiveness) is a method of measuring the performance of a piece of equipment or a process versus its theoretical maximum capacity. It is only measured for the time that the machine or process is scheduled to run. For instance, if the machine is scheduled to run for 8 hours per day, Monday to Friday, it is measured against the theoretical maximum output for 40 hours. If it’s a 24/7 machine, it is measured against a theoretical maximum of 168 hours
There are three components that make up OEE. OEE is the product of all three…
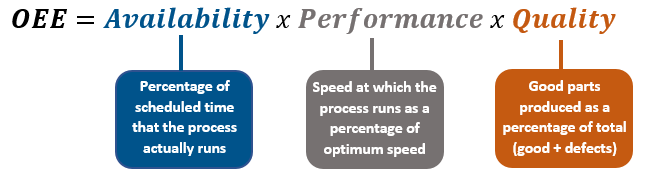
Availability is a measure of how much of the scheduled time a machine or process is available to run. When a machine or process is scheduled to run it has one of two states; it is either running (known as uptime) or it is not running (known as downtime). The aim is to maximise uptime by minimising downtime or stoppages. When a process is running it is producing parts, which creates value for the customer. When a process is stopped, it’s creating a cost to the business (e.g. staff must still be paid, customers may choose an alternative vendor, etc). There are many issues that impact on availability such as equipment issues, raw material outages, production operator issues, safety concerns and scheduling delays. Availability is calculated by comparing the actual run time of the process to the scheduled time of the process, expressed as a percentage.
Performance is a measure of how many parts are produced on the machine or process compared with the ideal number of parts. It only takes run time into account, i.e. the time that the machine was available to run. The time that the machine or process is stopped is not taken into account as that is factored into the Availability calculation. Examples of issues that impact performance include poorly maintained equipment that cannot run at optimum speed, short stoppages to adjust a machine or process, impromptu stoppages to check quality or trainee operators who are not experienced enough to run at full speed
Quality is a measure of how many good parts are produced on the machine or process compared with the total parts produced. Total parts includes defective products that must be discarded. Sometimes it is possible to rework defective parts so that they meet specification. Rework is a waste activity but if the cost of rework is negligible compared to the cost of scrapping the product, then a business decision may be made to allow it. However, like defects, rework should be eliminated where possible. In the OEE context, quality is often described as process yield (good parts ¸ total parts). First pass yield is a measure of how many good parts are produced at the first attempt versus the total parts produced. If a lot of parts are reworked (i.e. not successfully produced at the first attempt), then the first pass yield will be much lower than the final process yield.
A machine or process that has 100% OEE means that there is no downtime (100% availability), no performance loss (all parts are produced at the ideal speed) and no quality losses (100% of parts are good at the first attempt).
Sample OEE calculation
To explain the concept a little further, let’s take a look at a simple example of a process that was scheduled to run for 80 hours last week…
Scheduled Time:
Ideal output rate:
Downtime:
Actual Total Output:
Actual # good units:
Actual # defect units:
80 hours
90 parts/hour
8.5 hours
6,074 parts
5,850 parts
224 parts
Availability
Run time:
71.5 hours (80 hours – 8.5 hours)
Availability %:
89.4% (71.5 / 80)
Performance
Ideal output:
6,435 parts (71.5 hours x 90 parts)
Performance %:
94.4% (6,074 / 6,435)
Quality
Quality %:
96.3% (5,850 / 6,074)
OEE%:
81.3% (89.4% x 94.4% x 96.3%)
Tip: There is a quick way to calculate OEE, if all products produced have the same cycle time. In the example above, there were 80 hours available to build 90 parts per hour. In an ideal world, the process would have produced 7,200 good parts (80 hours x 90 parts per hour). 5,850 good parts were actually produced or 81.3% of the potential (5,850 / 7,200).
In reality, the calculation is much more complex for various reasons; break times have to be taken into account (for manual processes), hourly output rates can change when switching from one product to another, etc., etc. Kt-Pulse is very useful for measuring the components of OEE because it takes all of this, and more, into account for manual processes.
Benefits of OEE in manufacturing
The benefits come when OEE is measured correctly and then acted upon. Companies use methodologies like lean manufacturing and six sigma to identify and implement improvements that will increase OEE. An increase in OEE has many benefits
- Equipment is utilised to its fullest capacity, avoiding the need to purchase additional equipment unnecessarily
- Product / process quality improves (less material waste, increased customer satisfaction, less risk of product recalls)
- Output is more predictable, which improves production planning and customer on time deliveries
- The ability to scale improves
- Space utilisation is optimised
- Production operators become more efficient (less overtime needed, new people hired only when necessary)
- Market competitiveness improves (critical in many industries, such as medical devices and electronics).
How OEE can be applied in manual assembly environments
OEE is traditionally used to measure the performance of high volume, automated equipment. However, it can also be applied to manual processes that are run by production operators. The three components of OEE still apply to any operator-driven manufacturing process…
Availability: Operators work in a defined shift pattern with fixed breaks. If their process stops for unplanned or planned reasons, they log each event as downtime. This could be machine related or non-machine related
Performance: When the process is running, operators count and log output, usually on an hourly basis. Operators are expected to produce a certain number of parts per hour, which is a measure of performance
Quality: Operators detect defective parts as they work. Typically they will make a decision on whether the part should be scrapped or reworked and log it accordingly.
How Kt-Pulse extracts OEE data through the production operators
Tracking downtime, output and defects for manual or semi-automated processes is not easy when traditional paper or excel-based methods are used. Kt-Pulse makes it really easy to log downtime, output and defects in real-time through a simple app. A tablet or iPad is placed in a flexible holder right where the production operator is working. With quick button presses they can log each event as it occurs. Logged events are sent wirelessly to the Kt-Pulse database where it is instantly turned into real-time analytics. As new events come in, the dashboards are updated automatically, giving a real-time view of OEE, output, downtime and defects
OEE is traditionally used to measure equipment performance. Data is pulled from one or two sensors on machines, which means it has limited benefits in a manual assembly environment. Kt-Pulse, on the other hand, extracts data from the production operators, which is why we call it OLE, or Overall Line Effectiveness. Production operators rely on far more than one or two sensors; they use their 5 senses as well as their intuition every day on the manufacturing floor. This gives them a much deeper understanding of their manufacturing process. Using Kt-Pulse, the operators can now give instant feedback on everything that occurs at their manufacturing process in a fraction of the time, and with much greater accuracy, than a retrospective view captured on paper or Excel
Request a free demo: Kt-Pulse was designed exclusively for monitoring manual and semi-automated processes. Basically, any process run by a production operator. It simplifies how companies measure their processes and eliminates all of the time lost in creating production reports in Excel and PowerPoint. If you’d like to see for yourself how Kyzentree’s software, Kt-Pulse, can help you to monitor your processes in real-time, book a one-to-one, no obligation consultation today and we’ll showcase the benefits to you.
About Kyzentree: We are a recognised leader in improving productivity by making it easy to visualise and manage manufacturing operations. We specialise in operator-driven processes. We have brought together a team of manufacturing, lean-sigma and technology experts to bring you our flagship product Kt-Pulse™. Kt-Pulse is an app-based software solution built exclusively for monitoring any type of manual assembly, inspection or packaging process.