Features
The Kt-Pulse system has three components that work seamlessly together
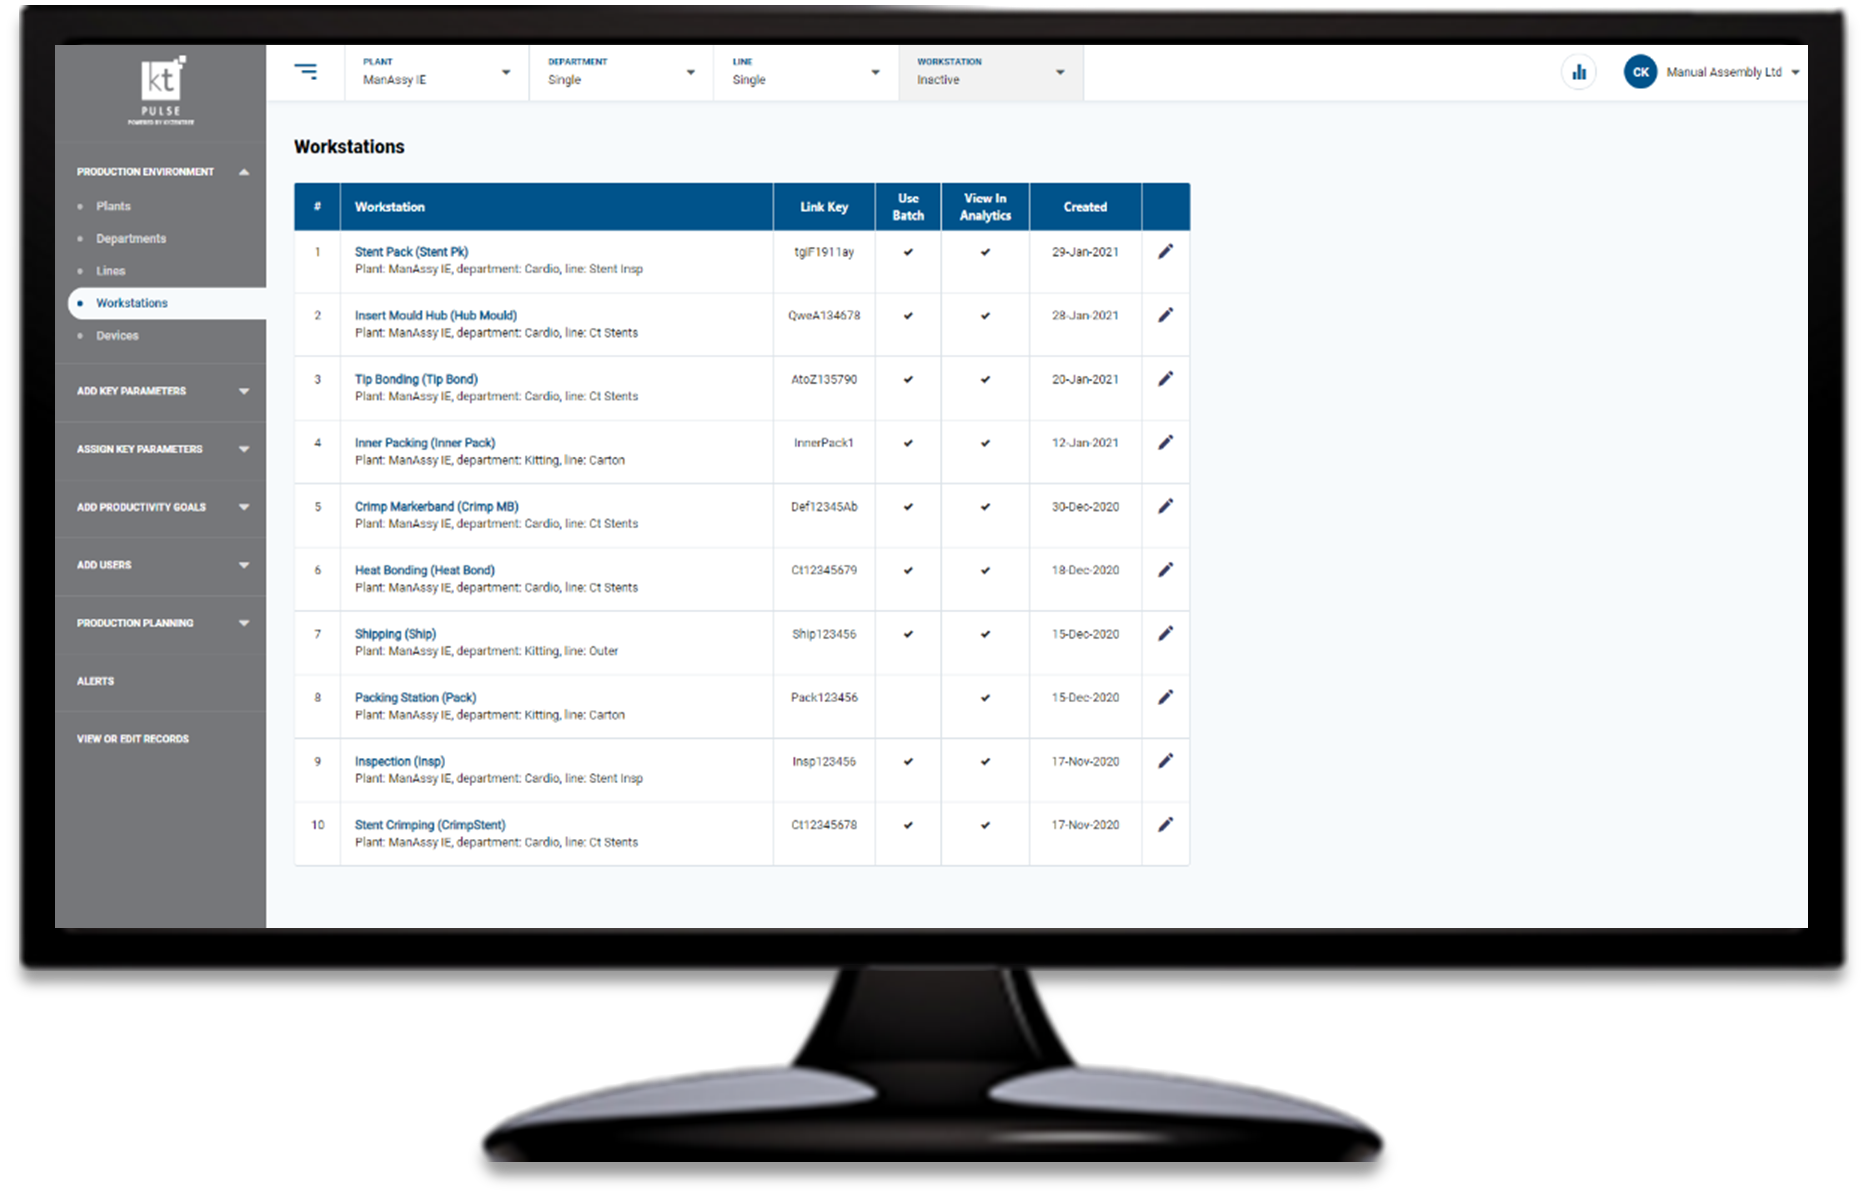
Setup
(setup web app)
Capture
(data collector mobile app)
Visualise
(analytics web app)
![]()
Setup
Add all of your key manufacturing parameters with a user-friendly and intuitive front end

Targeted downtime and scrap reasons
Create a company-wide list of downtime and scrap codes and assign them to the relevant workstations

Flexible output targets
Hourly output targets automatically adjust for scheduled break times and part number selection

Manage production scheduling
Schedule due dates for each production batch and prioritise the order of builds assigned to the production operators

Shifts and teams
Set up shift patterns and teams to analyse all of your key performance indicators by shift or team
![]()
Capture
Production operators log good units, defects and downtime events in real time through a simple touchscreen interface

Adjustable counts
Log one or multiple good units or defects with each button press

Capture lost time precisely
Log every downtime and changeover event precisely without guesstimating
Real-time productivity tracking
Production operators can see, at a glance, if they are on track to meet the output target for the current hour and shift

Swap the collector location
If you want to move the collector to a new process, enter the new link key and you are up and running in less than a minute
![]()
Visualise
Kt-Pulse is your visual factory tool. Keep everybody up-to-date on the production floor, in the office or remotely

Real-time analytics
Live snapshot views that highlight if output is on track and what processes need support

Shift summary analysis
Run more effective team meetings with accurate insights by shift, day, week or month

Trend analytics
Run charts and Pareto charts that help you discover where the biggest improvement opportunities exist

Drilldown
Review processes at a top level or use the drilldown function to discover deeper insights

Changeover analysis
Track changeover times precisely and quantify the impact of problems that arise during changeovers

Root cause analysis
The events list summarises every logged event. A great tool for root cause analysis of downtime and quality issues

Export to CSV or Excel
Export your data to CSV or Excel to carry out further analysis

Remote access
Access all of the Kt-Pulse analytics remotely when you can’t make it onto the production floor
Kt-Pulse in numbers

Productivity

Response time

Yield